If you are weighing a Hamptons investment, Hampton Bays often pops up as the attainable entry point with real summer demand. You want clear numbers, not hype. In this guide, you will see what current pricing looks like, how seasonal rentals actually perform, where yields are realistic, and the key risks to underwrite before you buy. Let’s dive in.
Market snapshot
Recent reports through late 2025 and early 2026 place Hampton Bays’ median values in a wide band, roughly 880,000 to 1.07 million. The spread reflects different methodologies. Zillow’s ZHVI is an automated, smoothed home value index, while brokerage and MLS reports capture quarterly median closings that can swing with small samples. The takeaway is simple: pricing sits near or just under the million mark, with property type and location driving large swings.
Inventory has been constrained but variable. Across 2025 the broader Hamptons tightened, while Hampton Bays stayed one of the more affordable submarkets that drew activity under 2 million. Expect seasonal listing spikes and month-to-month volatility, so use hyperlocal comps when you get serious on a property.
Days on market typically run in the double to low triple digits depending on the month, often around 75 to 125 days. This is not a rapid flip market, though homes positioned well for summer buyers can see stronger velocity in-season. Patient pricing and crisp presentation matter.
Rental demand and seasonality
Short-term rental demand is real, but highly seasonal. AirDNA’s Hampton Bays summary shows an average annual revenue near 38,200 dollars per listing, an average daily rate around 861 dollars, and average occupancy near 45 percent. Most listings are entire homes with three to five bedrooms, which aligns with family vacation demand. You can review the market snapshot on AirDNA’s Hampton Bays page for context on ADR and occupancy by month.
What about long-term rents? Typical year-round asking rents are materially lower than what you see in July and August. Summer seasonal leases can show eye-catching monthly figures because they reflect a short window at premium rates. Year-round leases trade for much less on a monthly basis. If you are underwriting a hybrid strategy, separate summer weekly pricing from shoulder-season and winter levels rather than applying a single average to every month.
Demand drivers include easy access to the bay and ocean, boating and marinas, and workable transit via the LIRR and Hampton Jitney. Family travel and coastal leisure anchor summer bookings, which is why renovated, family-sized homes close to water access tend to outperform.
What yields look like
Here is a simple framework you can adapt to any property. Label this as illustrative and always replace inputs with address-level data.
Formulas:
- Gross yield = gross revenue / purchase price.
- Net yield = (gross revenue - operating expenses) / purchase price.
Illustrative inputs:
- Purchase price scenario A: 885,000 dollars based on a lower recent median.
- Purchase price scenario B: 1,067,500 dollars based on a more recent median.
- Typical short-term rental gross revenue: about 38,200 dollars per year from AirDNA.
Illustrative outputs:
- Scenario A gross yield: 38,200 / 885,000 ≈ 4.3 percent.
- Scenario B gross yield: 38,200 / 1,067,500 ≈ 3.6 percent.
Now layer operating costs. A conservative net operating model often includes:
- Professional management at 20 percent of revenue.
- Cleaning and turnover, routine maintenance, and reserves for capital items.
- Insurance with coastal wind and flood considerations.
- Property taxes. Suffolk County tax burdens are meaningful. A county guide places median bills in the low to mid 9,000 dollars per year range, though your bill depends on assessment and school district. You can review the county tax context in this Suffolk property tax overview.
- Utilities and a vacancy buffer for shoulder and off-season months.
Under those inputs, many examples compress into low single-digit net operating yields, often around 0.5 to 2 percent before debt service. That does not mean the investment fails. It means cash flow depends heavily on your rate, down payment, and whether you can add value that moves ADR and occupancy.
Property types that tend to work
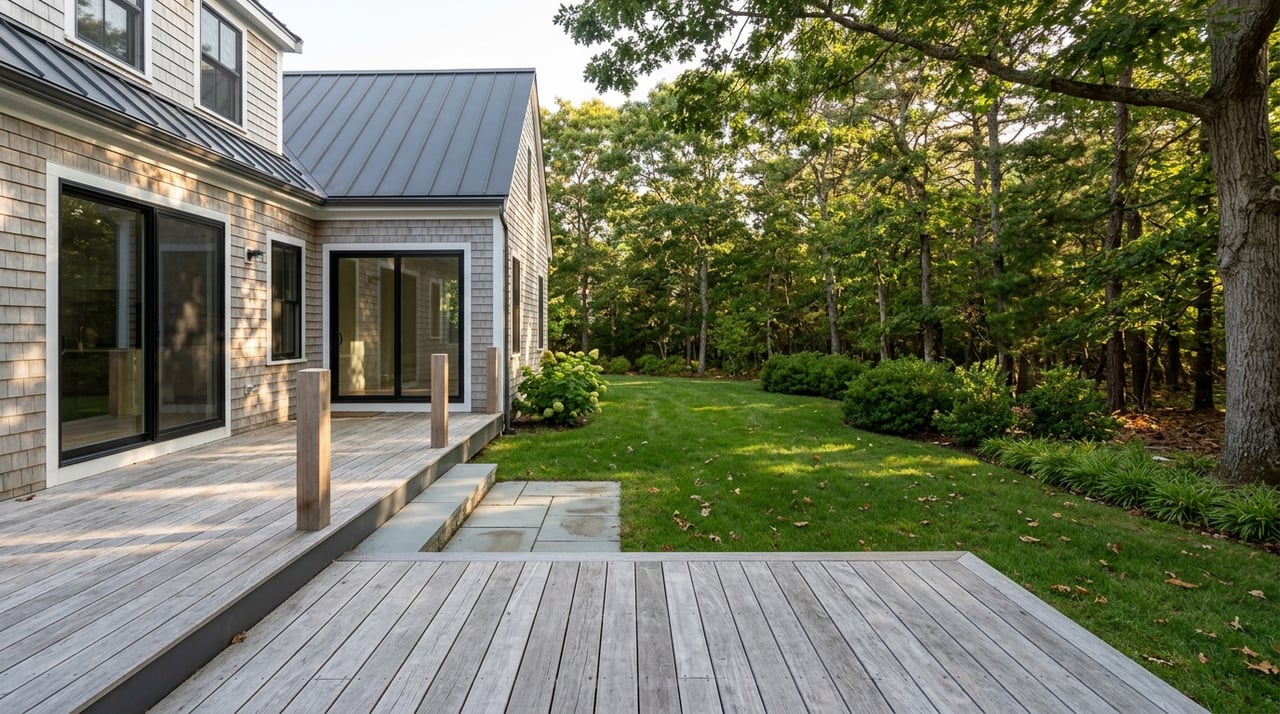
- Waterfront or canal homes with mooring. Direct water or dock access commands a price premium and higher peak-season ADRs. AirDNA data indicates stronger performance for water-proximate listings, which is consistent with boater demand in Hampton Bays.
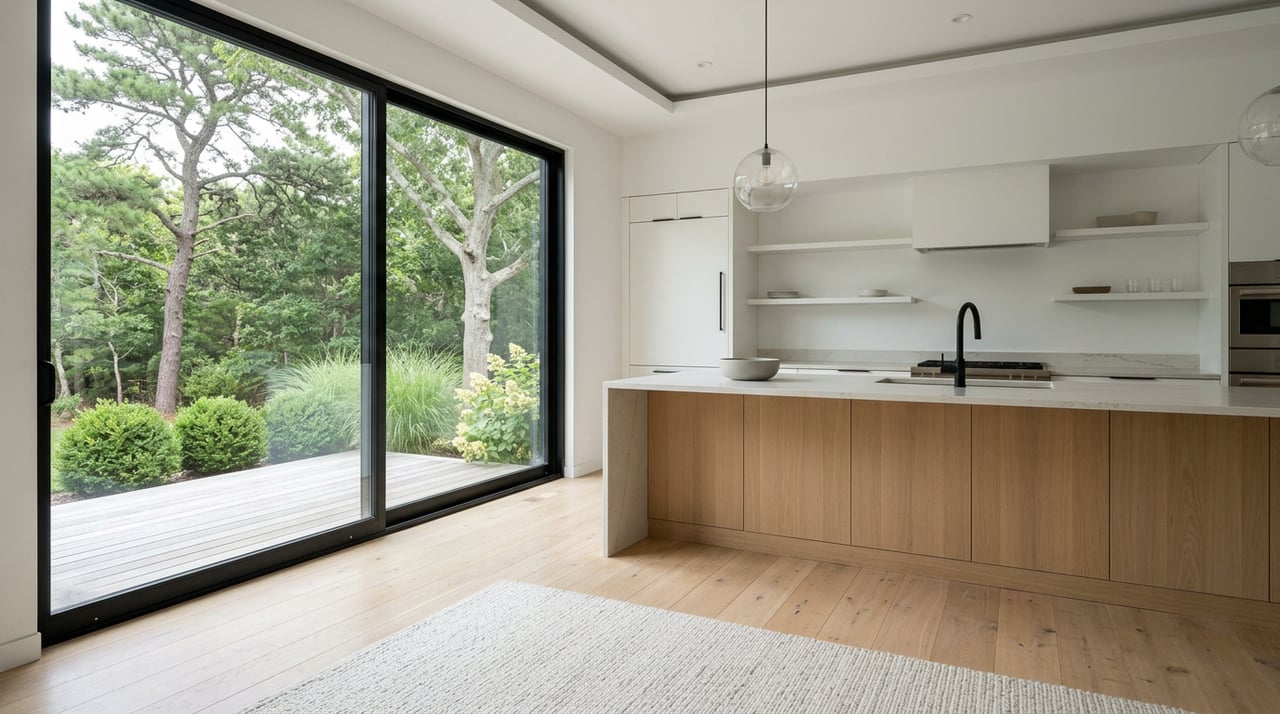
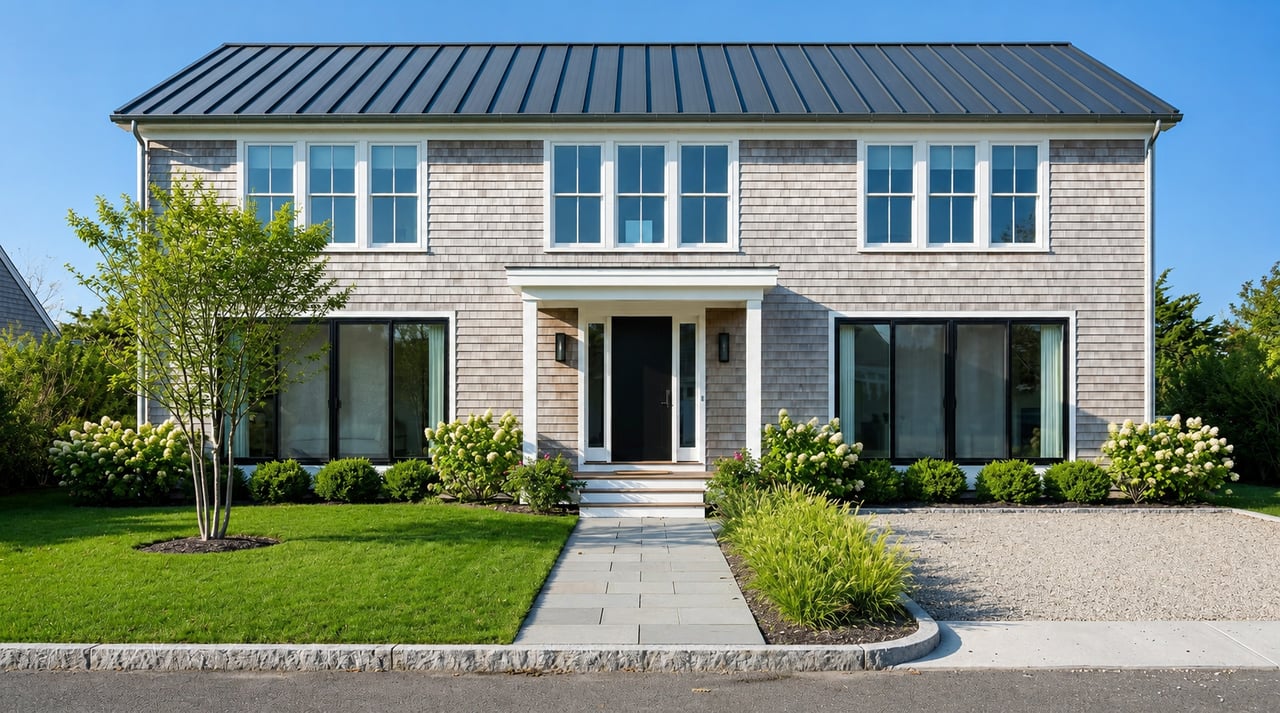
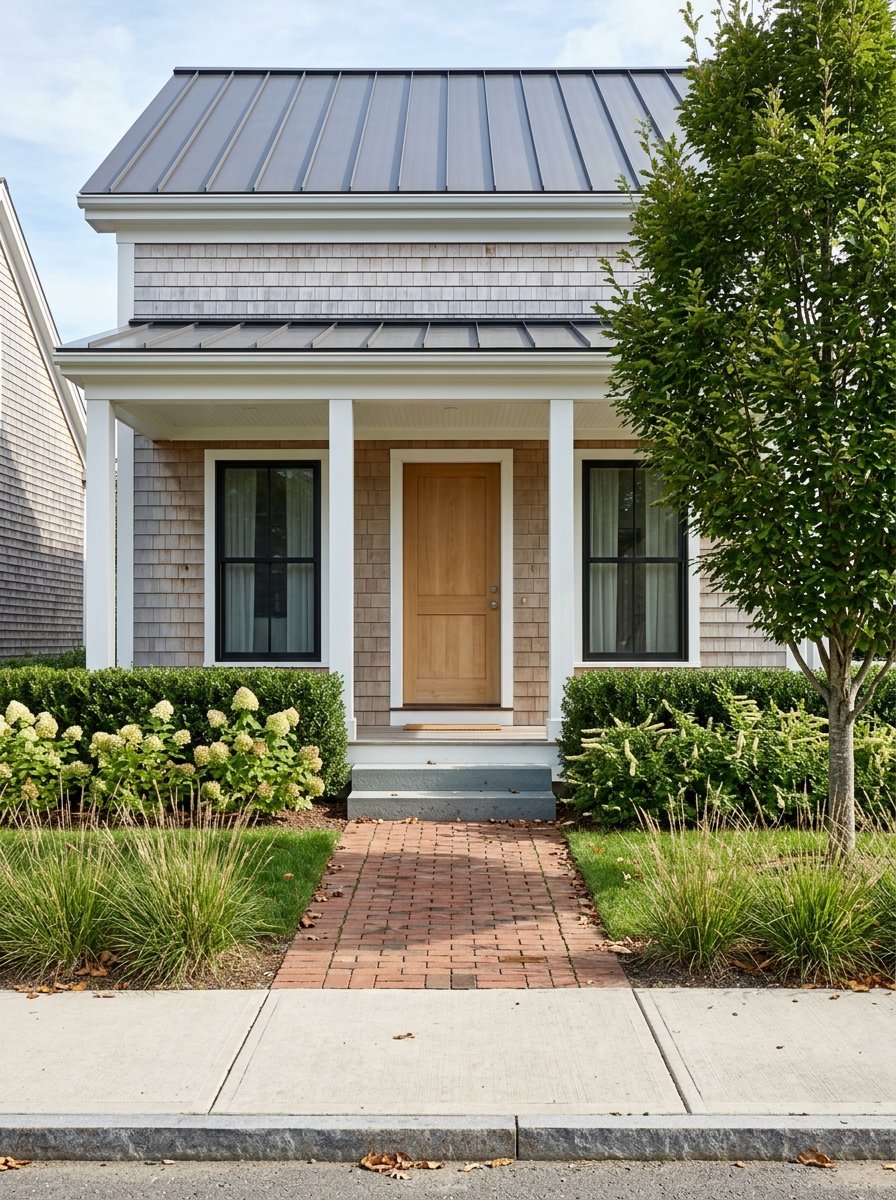
- Renovated 3 to 5 bedroom single-family homes. This is the sweet spot for family travel, and most short-term rental supply already skews in this direction. Clean, modern finishes and outdoor amenities like a pool or deck add booking velocity.
- Year-round rentals for local tenants. Monthly rent is lower than summer rates, but occupancy is steadier. Some owners run a hybrid approach, offering weekly summer stays and longer winter leases to smooth revenue.
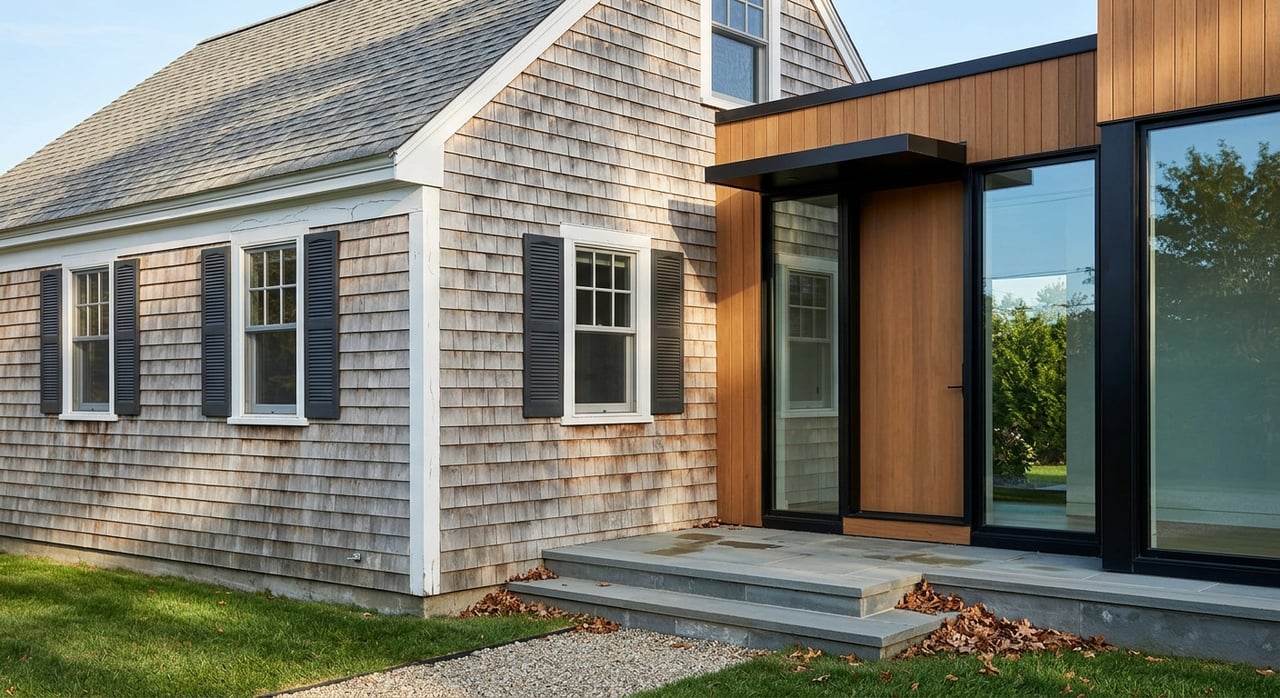
- Value-add renovation. Repositioning an outdated home into a brighter, family-ready vacation property can lift ADR. This route requires careful budgeting, a clear read on permitting timelines, and attention to FEMA compliance where relevant.
Key risks to underwrite
- Regulation. The Town of Southampton actively enforces rental permitting and has identified illegal short-term rentals as a priority. Minimum stays, registration programs, or other rules can change. Always confirm current town code and process before you rely on short-term income. You can review a recent town enforcement update for context on priorities and permitting resources.
- Climate and insurance. Flood and wind exposure is real for a meaningful share of properties. Insurance quotes can vary widely based on elevation, mitigation, and proximity to water. Pull FEMA flood zone status and get current quotes for both wind/hurricane and flood coverage before you finalize assumptions.
- Property taxes and carrying costs. Suffolk County and Long Island taxes are higher than many state medians, and local levies can add materially to annual costs. Start underwriting with the actual tax bill and be conservative about future increases. For context on county tax levels and timelines, see this Suffolk tax guide.
- Seasonality. Summer concentrates revenue, while shoulder and winter months drop. Do not apply a single average across the calendar. Use ADR and occupancy curves to map revenue by month. AirDNA’s monthly views can help you shape a realistic RevPAR curve.
- Financing. Investment property rates and loan program rules for short-term rentals can affect leverage and cash flow. Underwrite with current lender quotes and stress test your debt coverage at multiple rates.
- Community context. Local reporting has highlighted community pressure around short-term rentals and housing availability. Understanding sentiment and compliance expectations helps you avoid missteps. For more background, read this local perspective on rental pressures.
How Hampton Bays compares
- Entry price. Relative to Bridgehampton, Sag Harbor, East Hampton, and some Southampton neighborhoods, Hampton Bays is notably more affordable. Recent Hamptons matrices show those villages with multi-million medians while Hampton Bays sits near or below 1 million. That lower entry cost is a core draw for investors.
- Yield tradeoff. Lower purchase prices help the gross-yield math, but ADRs in premier villages can be much higher. Hampton Bays offers respectable gross revenue for its price band, while net yields often compress once you factor management, taxes, and insurance. It can still pencil, especially if you add value or lock in favorable financing.
- Appreciation potential. The Hamptons saw strong appreciation through the pandemic era and into 2024 to 2025 at the high end. Lower-priced hamlets like Hampton Bays can benefit from spillover when inventory tightens elsewhere. Long-term upside is driven by coastal land constraints and amenity demand, though it is never guaranteed.
Investor checklist
- Confirm the latest short-term rental rules. Review Town of Southampton permitting requirements, enforcement focus, and any minimum stay updates before you underwrite.
- Pull property-level performance. Use AirDNA or similar tools to analyze ADR, occupancy, and revenue for your exact micro-location and home type rather than relying on townwide averages.
- Check flood and wind exposure. Verify FEMA flood zone status and obtain current NFIP or private flood quotes plus wind/hurricane coverage. Tie premiums to your cash flow model.
- Use hyperlocal comps. Work from MLS sales in the last 6 to 12 months that match property type and micro-neighborhood, such as canal versus bay-adjacent versus inland.
- Validate the tax bill. Get the actual bill, confirm school district levies, and bake in an increase buffer. For county-level context, reference the Suffolk tax overview linked above.
- Build an operating budget. Include management, cleaning, utilities, maintenance, and a reserve for capital projects. Do not forget permit fees and pool or landscape care if applicable.
- Stress test your yield. Cut assumed occupancy by 20 to 40 percent and raise taxes and insurance by 10 to 30 percent to see downside sensitivity. AirDNA’s monthly data can help you model realistic seasonality.
Is Hampton Bays a smart buy right now?
If you want a lower-cost foothold in the Hamptons with real summer rental demand and you are comfortable with modest net yields plus diligent underwriting, Hampton Bays can make sense. The market rewards well-located, renovated homes that speak to family travel and water access. Your edge comes from buying the right property, pricing smartly by season, and budgeting conservatively for taxes and insurance.
If you need high cash-on-cash returns from day one or prefer a year-round market with minimal seasonality, you may find the numbers tight. In that case, a long-term lease strategy or a different submarket may fit better. Either way, a property-specific plan will clarify where Hampton Bays sits in your portfolio.
Considering a Hampton Bays purchase or reposition? Connect with the local team that markets luxury homes and manages seasonal rentals across the East End. Reach out to Stoebe & Co. for property selection, pricing guidance, and a tailored ownership plan.
FAQs
What is the current median home price in Hampton Bays?
- Recent reports through late 2025 and early 2026 place medians in a broad 880,000 to 1.07 million range, with variation driven by methodology and small sample sizes.
How much can a typical short-term rental in Hampton Bays gross per year?
- AirDNA’s local summary shows about 38,200 dollars in average annual revenue per listing, with around 45 percent occupancy and an ADR near 861 dollars.
Are short-term rentals legal in Hampton Bays, and what permits are required?
- Short-term rentals are regulated by the Town of Southampton, which actively enforces permits and compliance; always verify current rules before operating.
How do summer rents compare with year-round rents in Hampton Bays?
- Summer weekly or monthly rates can be far higher due to short, peak demand windows, while typical year-round asking rents are much lower on a monthly basis.
What are typical property taxes for Suffolk County homes?
- County medians are in the low to mid 9,000 dollars per year range, but your actual bill depends on assessment and school district; confirm the property’s current tax bill.
How long do homes in Hampton Bays usually take to sell?
- Days on market often range from about 75 to 125 days depending on the season; well-positioned homes tend to move more quickly in peak months.
Which property types tend to outperform for STRs in Hampton Bays?
- Renovated 3 to 5 bedroom homes and properties with direct water or canal access typically command higher ADRs and attract family bookings in peak season.